Quality v’s productivity
There has for a long time been a debate about the relative merits and associated trade-offs regarding quality and productivity.
Many people think that these are inversely proportional, that is; if one goes up the other has to go down. In fact, in many cases, exactly the opposite is true.
In this article I’d like to explore a couple of recent examples we have worked on then look at more general lessons for business.
One of our clients, a £6m turnover manufacturer of electronic devices, described part of one of their production processes as per the figure below:
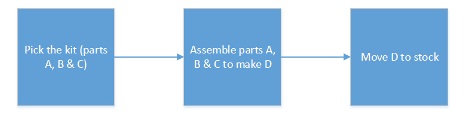
Obviously, with electronics there were significantly more than 3 parts, the above is only a simplified illustration.
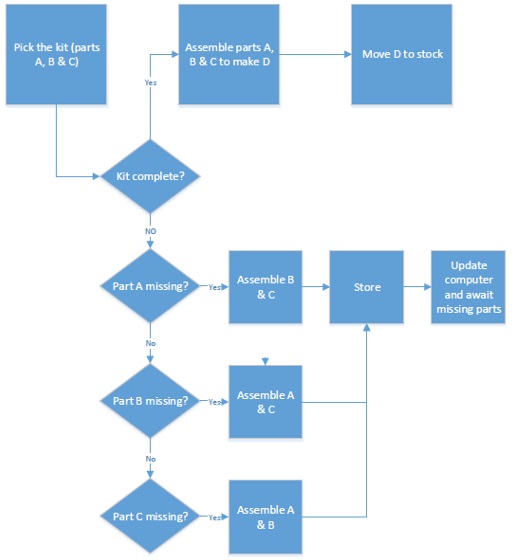
However, on investigation, the actual process was fraught with difficulty; fundamentally, parts were often unavailable so the process actually looked more like the second diagram below. (Only more complicated because instead of the 3 parts in the diagram there were, depending on the product, anywhere between about 20 and 70 different parts).
Consequently, the way in which the process actually worked was the staff, to the best of their ability would complete the work with whatever parts were available and then log the partially complete assembly into the computer system.
When the next batch of missing parts arrived the complete assembly would be booked out of stock and worked on again. In some instances parts would take a number of trips into and out of the stores area, being booked in and booked out each time until the part was finally complete.
As a result the work, as described in the first figure above can be considered the real, value adding work, the work in the second figure, particularly the work below the dotted line, can be considered non value adding or waste work. Just consider for a moment the level of waste:
- The multiple set up times
- The multiple entries into and out of the stock system
- The multiple journeys of people and product backwards and forwards from the store
The effects on quality and productivity
As a result of the above decision there were a number of effects:
The effects on people
In this particular example the company, with a new MD, is currently on a mission to drive the turnover from £6m to £10m in three years. The market is certainly there, as is the company’s reputation, which has been significantly enhanced because they are now able to process orders in a significantly more consistent and speedy fashion.
In addition to the above, the work of the supervisors also changed dramatically. Previously there had been a lot of firefighting, for instance:
Understandably, there is usually some degree of apprehension when these changes occurred but people were freed up to take on much more creative and productive work which (most) people found much more satisfying.
Win-Win
In the above example costs have gone down, productivity has gone up and quality has gone up, all good news for the company’s management, but what about the workforce?
If the management’s intention is to grow and develop the company, as it is in this particular case, the future not only looks promising for the company but job security has significantly improved and the possibility of advancement is also opened up for those that want to take those opportunities. Win-win.
The chain reaction
The above thinking is not new and has been represented for years in what has been called the chain reaction.
If we have better quality and lower prices we can expand the market and stay in business and expand the company by providing more jobs. In addition it has been suggested by Brian Joiner that there should be an additional box to the right hand side…to provide a better return on investment. I certainly can’t disagree with that!
Lessons for business
The above is obviously written around a manufacturing company. However, the same thinking has been applied to a purely service company who process applications for particular maritime “tickets” (qualifications) for individual mariners. Any individual requiring the qualification has to collect evidence of their progress over a 5 year period. Thereafter, this evidence has to be submitted, verified and processed before the “ticket” is issued. Given that this particular process is fraught with reputational risk; the company do not want a “Costa Concordia episode” on their conscience, they have to be extremely diligent with the processing regime.
Prior to undertaking our work with this particular organisation, applications were being processed in anywhere between 150-250 days and the mariners were (understandably) rebelling. Since being appointed we have provided hands on training in the thinking, tools and techniques of improvement; following which a number of internal improvement teams were created and they then made changes to the processes employed … applications are now being processed in less than 30 days …and we are sure we can improve on this. A massive change with no capital investment.
So, how was this achieved? Essentially we looked at the process and devided the work into two different categories:
T - Transport
I - Inventory
M - Movement
W - Waiting and delays
O - Over production or over delivery
O - Over processing
D - Defects / duplication
The point can be illustrated by thinking about value added and non-value added activities as represented below:
As a result of the above decision there were a number of effects:
- Quality improved because the components could be produced by one person in one sitting
- Productivity improved because less time was being spent undertaking non value adding activities
- Inventories of part produced products decreased freeing up space and cash
- The work flow became much cleaner and simpler (more like the first diagram)
- The overall time to manufactured products fell dramatically
The effects on people
In this particular example the company, with a new MD, is currently on a mission to drive the turnover from £6m to £10m in three years. The market is certainly there, as is the company’s reputation, which has been significantly enhanced because they are now able to process orders in a significantly more consistent and speedy fashion.
In addition to the above, the work of the supervisors also changed dramatically. Previously there had been a lot of firefighting, for instance:
- Progress chasing
- Physical stock checking
- Expediting of parts
- Interrupting staff with revised activities
Understandably, there is usually some degree of apprehension when these changes occurred but people were freed up to take on much more creative and productive work which (most) people found much more satisfying.
Win-Win
In the above example costs have gone down, productivity has gone up and quality has gone up, all good news for the company’s management, but what about the workforce?
If the management’s intention is to grow and develop the company, as it is in this particular case, the future not only looks promising for the company but job security has significantly improved and the possibility of advancement is also opened up for those that want to take those opportunities. Win-win.
The chain reaction
The above thinking is not new and has been represented for years in what has been called the chain reaction.
If we have better quality and lower prices we can expand the market and stay in business and expand the company by providing more jobs. In addition it has been suggested by Brian Joiner that there should be an additional box to the right hand side…to provide a better return on investment. I certainly can’t disagree with that!
Lessons for business
The above is obviously written around a manufacturing company. However, the same thinking has been applied to a purely service company who process applications for particular maritime “tickets” (qualifications) for individual mariners. Any individual requiring the qualification has to collect evidence of their progress over a 5 year period. Thereafter, this evidence has to be submitted, verified and processed before the “ticket” is issued. Given that this particular process is fraught with reputational risk; the company do not want a “Costa Concordia episode” on their conscience, they have to be extremely diligent with the processing regime.
Prior to undertaking our work with this particular organisation, applications were being processed in anywhere between 150-250 days and the mariners were (understandably) rebelling. Since being appointed we have provided hands on training in the thinking, tools and techniques of improvement; following which a number of internal improvement teams were created and they then made changes to the processes employed … applications are now being processed in less than 30 days …and we are sure we can improve on this. A massive change with no capital investment.
So, how was this achieved? Essentially we looked at the process and devided the work into two different categories:
- Value adding work
- Non-value adding work
T - Transport
I - Inventory
M - Movement
W - Waiting and delays
O - Over production or over delivery
O - Over processing
D - Defects / duplication
The point can be illustrated by thinking about value added and non-value added activities as represented below:

Each of the above (red) non value adding activities will contain one or more of the issues described in the Tim Wood mnemonic, for example;
In fact a recent study by the Lean Construction Institute gave the following percentages to three different categories of work:
A key point here is if you manage your business and treat your staff properly many are very keen to help out and assist when things go wrong or extra effort has to be applied… to get the job done and to satisfy the customer under any circumstances. However, in actual fact, their time and effort would be better spent focusing on waste and ensuring their job could be done more effectively and efficiently in the first place.
Conclusion
As Joiner, and the example, above suggests with higher quality and lower costs there is significantly more opportunity to respond to the market. Prices could be reduced to hurt the completion alternatively, prices could be maintained in order to improve margin - obviously, neither of these strategies are mutually exclusive.
However, a word of warning, some would have us believe that we can start the above process ignoring the first, “improve quality”, stage in the above diagram! As can hopefully be seen it is a recipe for failure, if you don’t start at improve quality you don’t eliminate the “causes” of costs. Cost cutting alone usually results in further problems which requires further cost cutting and often sets off a vicious downward spiral.
Consequently, there is a real difference between “cost cutting” and “reducing the causes of costs”. In the electronics company example above if we had insisted on cutting staff or an overtime reduction all of the complexity would have remained in the process and the situation would have very probably have got worse. In the short term productivity might have improved due to less staff but the key issues would have remained buried and hidden.
Working with teams that understand the thinking, tools and techniques of improvement and understanding the organisation as a network of connected parts can set in train a movement where customers are delighted and people and stakeholders take pride in improved quality, lower costs, reduced waste and improved productivity…and better returns on investment.
In the next article we will look more deeply at the organisation as a system of interconnecting parts.
For additional information please feel free to call me directly on 07976 426 286 or email me on [email protected]
References: Brian L Joiner, Fourth Generation Management (McGraw-Hill Inc). Dr W. Edwards Deming, Out of the Crisis (The MIT Press)
www.statius.co.uk
- The core value adding activity of making the product or delivering the service could involve any of the aspects described by the Tim Wood mnemonic
- Processing paperwork will often involve being stacked up so it can be processed in batches so will involve - inventory, waiting and delay and may indeed include defects and duplication
- Chasing payment will often need repeated calls and emails chasing payment from poor payers as a result of which it might be found that errors (defects) and indeed duplication exist
In fact a recent study by the Lean Construction Institute gave the following percentages to three different categories of work:
- Value creating work – the green areas of the above bar (5-10%)
- Waste – aspects of the both the green and the red areas in the above bar (55-65%)
- Work that is necessary to support the creation of value – this would include things like training staff and other HR issues, accounts processing etc, essentially things that need to be done but that do not add direct value to the client. In which of course there would be their own areas of waste! (30-35%)
A key point here is if you manage your business and treat your staff properly many are very keen to help out and assist when things go wrong or extra effort has to be applied… to get the job done and to satisfy the customer under any circumstances. However, in actual fact, their time and effort would be better spent focusing on waste and ensuring their job could be done more effectively and efficiently in the first place.
Conclusion
As Joiner, and the example, above suggests with higher quality and lower costs there is significantly more opportunity to respond to the market. Prices could be reduced to hurt the completion alternatively, prices could be maintained in order to improve margin - obviously, neither of these strategies are mutually exclusive.
However, a word of warning, some would have us believe that we can start the above process ignoring the first, “improve quality”, stage in the above diagram! As can hopefully be seen it is a recipe for failure, if you don’t start at improve quality you don’t eliminate the “causes” of costs. Cost cutting alone usually results in further problems which requires further cost cutting and often sets off a vicious downward spiral.
Consequently, there is a real difference between “cost cutting” and “reducing the causes of costs”. In the electronics company example above if we had insisted on cutting staff or an overtime reduction all of the complexity would have remained in the process and the situation would have very probably have got worse. In the short term productivity might have improved due to less staff but the key issues would have remained buried and hidden.
Working with teams that understand the thinking, tools and techniques of improvement and understanding the organisation as a network of connected parts can set in train a movement where customers are delighted and people and stakeholders take pride in improved quality, lower costs, reduced waste and improved productivity…and better returns on investment.
In the next article we will look more deeply at the organisation as a system of interconnecting parts.
For additional information please feel free to call me directly on 07976 426 286 or email me on [email protected]
References: Brian L Joiner, Fourth Generation Management (McGraw-Hill Inc). Dr W. Edwards Deming, Out of the Crisis (The MIT Press)
www.statius.co.uk
 RSS Feed
